Collecting logs
Standard logs
Everytime the Orthanc service starts, it will generate
a new log file in C:\Program Files\Orthanc Server\Logs on Windows
and in /var/log/orthanc/ on Linux.
By default, on Windows, if the Orthanc service fails to start, it will retry to start 5 times and stop so it does not generate thousands of log files.
Log files are named as Orthanc.log.YYYYMMDD-hhmmss.ffff including
the date/time when Orthanc was started.
Orthanc is not removing old logs so these log files might accumulate and consume lot’s of space. It’s up to you to manage the logs folder to make sure you don’t fill your disk with logs.
Generating an exploitable debug log
By default, the Orthanc logs contain only the WARNING and
ERROR information levels. For your logs to be exploitable by the
Orthanc community, you must include more information by adding the
--verbose or --trace command-line options, which will add the
INFO and TRACE information levels. If you are starting Orthanc
from the command-line, simply add these flags and redirect the
standard outputs to some log file. For instance:
$ ./Orthanc --trace --logfile=orthanc.log
Note that the Orthanc command-line tool has many other options related to logging. Check out the full manpage.
However, if you use packaged versions of Orthanc that starts the server in background (such as GNU/Linux packages or the Windows installers), you will have to manually start Orthanc. The sections below explain how to achieve this goal with the officially supported packages.
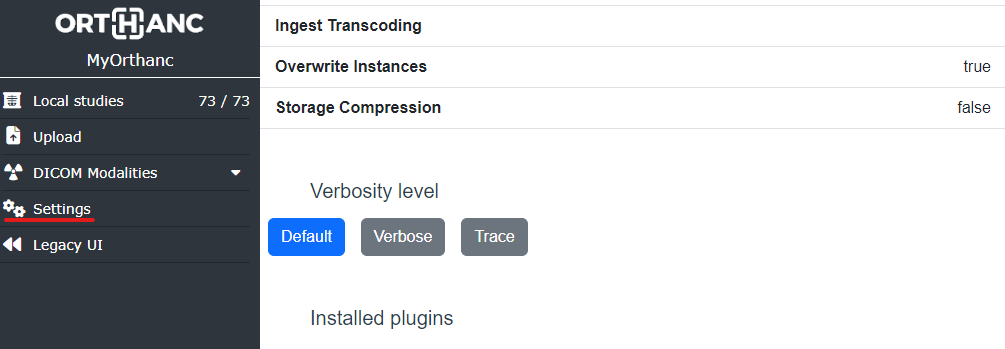
With Orthanc Explorer 2 installed
If you have the Orthanc Explorer 2 plugin enabled, open the settings pane at http://localhost:8042/ui/app/#/settings and change the verbose level from there without restarting Orthanc:
Under Windows
If you used the official Windows installers:
Stop the Orthanc service. The actual process depends on your version of Windows.
Make sure you have a
C:\Tempfolder available to store the log file.In a command-line shell, manually start Orthanc to generate the
Orthanc.logfile:$ "C:\Program Files\Orthanc Server\Orthanc.exe" --verbose "C:\Program Files\Orthanc Server\Configuration" > C:\Temp\Orthanc.log 2<&1
This will start Orthanc with exactly the same configuration as your service, but in verbose mode.
Once the log has been generated (in
C:\Temp\Orthanc.log), stop Orthanc and possibly restart the Orthanc service.
By default, the Orthanc service will always start in the default Warning log level.
If you want to make it start in Verbose mode at every start, you should set this Registry
Key to 1:
Computer\HKEY_LOCAL_MACHINE\SOFTWARE\WOW6432Node\Orthanc\Orthanc Server\Verbose
Under Debian GNU/Linux
Stop the Orthanc service:
$ sudo /etc/init.d/orthanc stop
Manually start Orthanc (using the same configuration as the service) and generate the log:
$ sudo -u orthanc /usr/sbin/Orthanc --verbose /etc/orthanc/ > Orthanc.log 2>&1
Restart the Orthanc service:
$ sudo /etc/init.d/orthanc start
Under Docker
With orthancteam/orthanc images, simply define the VERBOSE_ENABLED environment
variable to true when starting your container and then, run this command to
retrieve the logs in a file:
$ sudo docker logs your_container_name &> /tmp/orthanc.log
With jodogne/orthanc images, use this command line:
$ sudo docker run -a stderr -p 4242:4242 -p 8042:8042 --rm jodogne/orthanc --verbose /etc/orthanc > Orthanc.log 2>&1
Changing the log level while Orthanc is running
Starting with Orthanc 1.6.0, you can dynamically change the log level while Orthanc is running using the REST API:
$ curl -X PUT http://localhost:8042/tools/log-level -d "verbose"
$ curl -X PUT http://localhost:8042/tools/log-level -d "trace"
$ curl -X PUT http://localhost:8042/tools/log-level -d "default"
Log categories
Starting with Orthanc 1.8.2, log messages are associated with a category. The category indicates the subsystem of Orthanc from which the message comes (such as the embedded HTTP server, the DICOM communications, Lua scripts…).
It is possible to choose a different log level for each category. This can be done when starting Orthanc as follows:
$ ./Orthanc --verbose-http --trace-dicom
This command would start Orthanc in verbose mode for HTTP-related
messages, and would enable debug messages related to DICOM. The full
list of the available log categories (http, dicom, lua,
plugins…) can be found in the manpage of Orthanc or by starting Orthanc with the --help flag.
It is also possible to dynamically change the log level of a category while Orthanc is running by using the REST API, for instance:
$ curl -X PUT http://localhost:8042/tools/log-level-http -d "verbose"
$ curl -X PUT http://localhost:8042/tools/log-level-dicom -d "trace"
$ curl -X PUT http://localhost:8042/tools/log-level-plugins -d "default"
The list of the available log categories is also available through the
REST API, by inspecting the URIs that are prefixed by
/tools/log-level:
$ curl http://localhost:8042/tools/
  [...]
  "log-level",
  "log-level-dicom",
  "log-level-generic",
  "log-level-http",
  "log-level-jobs",
  [...]
Remarks:
Messages that are not associated with a well-identified category are considered as belonging to the
genericcategory.Using the
--verboseor--tracecommand-line options, or changing the value of the/tools/log-levelURI will reset the log level of all the categories. Note that the command-line options are applied from left to right.Provided that you have left the
DeidentifyLogsconfiguration to itstruedefault value, Orthanc logs will not contain any sensitive patient information atdefaultorverboselevel; however, attracelevel, the DICOM logs will still contain PHI.Starting from Orthanc 1.12.2, Orthanc is logging the thread name in the logs. If you need to revert back to the previous format, add the
--logs-no-threadcommand line option at startup.